The fashion trends that are warming up for spring
When the weather changes, so do our fashion preferences. Out with the sweaters and flannel, in with the swimsuits and florals — to celebrate the closet switch-up, we’re sharing some interesting fashion trends and queries from Google Shopping. For starters, people are looking to history for inspiration: The most-searched fashion trends over the past 30 days in the U.S. are “80s fashion,” followed by “90s fashion,” “y2k fashion,” “2000s fashion” and “70s fashion.”
If you’re not ready for your closet to go back in time, there are a few other springtime-related search trends that might fit a bit better (pun intended) — starting with florals. (We know, we know: groundbreaking.)
“Sunflower bathing suit” is a breakout search over the past 30 days in the U.S., as is “floral handbag,” which saw a +140% spike over the same period of time. Nail art search trends included the phrases “sunflower,” “daisy,” “summer” and “spring,” as well.
And while it’s not a floral per se, the color green — which is definitely garden adjacent — is also having a moment: “Green glitter nails” spiked more than 130% over the past 30 days in the U.S. “Green Prada shoes” saw nearly the same rise (+100%) within the last month, too. Green was also the most-searched nail polish color, and the second-most popular color in searches for handbags after black. Which obviously raises the question: Is green the new black!? Keep an eye on spring fashion to find out.

Router Wi-Fi 6 EERO 6 in bundle con hub Zigbee intelligente ad un prezzo FOLLE su Amazon
How AI and imagery build a self-updating map
Building a map is complex, and keeping it up-to-date is even more challenging. Think about how often your city, town or neighborhood changes on a day-to-day basis. Businesses and shops open and close, stretches of highway are added, and roadways change. In today’s Maps 101 installment, we’ll dive into two ways Google Maps uses advancements in AI and imagery to help you see the latest information about the world around you every single day.
Automatically updating business hours
Over the past few years, businesses have experienced a lot of change — including constantly updating operating hours based on changing pandemic-related restrictions. To keep up with this pace of change, we developed a machine learning model that automatically identifies if business hours are likely wrong, then instantly updates them with AI-generated predictions.
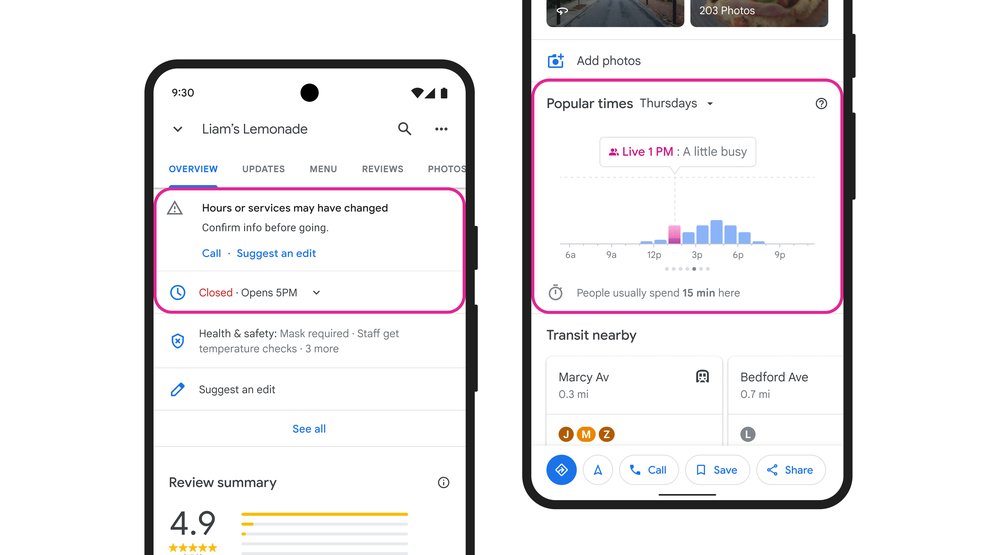
Let’s look at Liam’s Lemonade Shop as an example. To start, our systems consider multiple factors — such as when Liam last updated their business profile, what we know about other shops’ hours, and the Popular Times information for the shop, which uses location trends to show when it tends to be busiest. Since it appears that Liam’s business profile hasn’t been updated in over a year and its busiest hours are typically Thursday afternoons — even though Google Maps says that it’s closed at that time — Liam’s business hours are likely out of date.
To see if business hours need updating, we check a store’s Popular Times information and when its business profile was last updated.
So what’s next? Our algorithms analyze the business hours of other nearby lemonade shops, information from Liam’s website, and Street View images of Liam’s storefront that look specifically for business hour signs to determine the most accurate business hour prediction. At the same time, we enlist the help of the Google Maps community — including Local Guides and even the business owners themselves through their Google Business Profile — to verify the information we predicted. In Argentina, Australia, Chile, France, Japan, Mexico, New Zealand, Peru, and the United States, we also use Duplex conversational technology to call businesses just like Liam’s and ask for their hours directly. With this new AI-first approach, we’re on track to update the hours for over 20 million businesses around the globe in the next six months – helping you know exactly when your favorite store, restaurant or cafe is open for business .
Road information that reflects the real world
We’re also experimenting with ways we can use imagery to make updates to other helpful information. For instance, starting in the U.S., we’re launching a third-party imagery pilot to let you see the most up-to-date speed limit information in your town, which can help keep you safe while driving. Here’s how it works:
Say our systems think that the speed limit information on a particular highway needs to be updated. With the help of third-party imagery partners that already gather roadway imagery to improve delivery routes, we can request a photo of the specific stretch of road that also includes a speed limit sign. If the partner has this photo available, we then use a combination of AI and help from our operations team to identify the sign in the image, extract the new speed limit information, and update Google Maps.
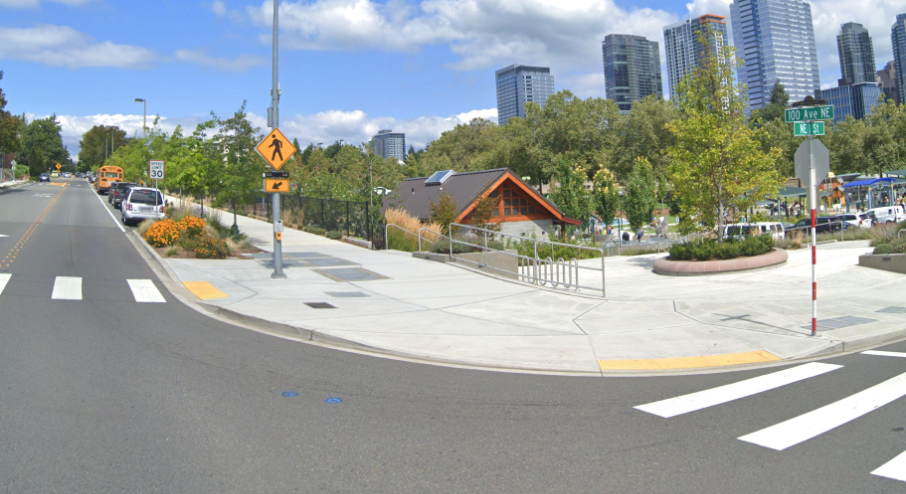
Representative imagery featuring a speed limit sign, with license plates blurred
Over time, this technology will bring more details to the map that can help make your drives safer and more efficient — like where potholes and school zones are or where new construction is happening. And as with all Google Maps features, we designed this pilot with privacy top of mind. For instance, we only reference images taken on public roads, and partners are required to blur information (like faces and license plates) to avoid potentially identifying someone. For an extra layer of privacy, we blur the photo again when we receive it and delete the photo after we use it to update the map.
AI, imagery and Duplex technology will continue to play a critical role in helping make Google Maps the most comprehensive and useful map possible. For more behind-the-scenes looks at the technology that powers Google Maps, check out the rest of our Maps 101 blog series.
Tastiera wireless che usi OVUNQUE: 17€ e diventa tua
Xiaomi ti asciuga i capelli in modo SMART: 29€ e non te ne penti

Il tuo PC diventa una scheggia con questo SSD Kingston a 48€

ADDIO PELI ed estetista: con questo epilatore laser fai l’AFFARE
Dare nuova vita ai dati climatici attraverso l’arte
Alcuni dei cambiamenti più drammatici alimentati dal clima sul nostro pianeta stanno accadendo in luoghi che la maggior parte di noi non ha modo di visitare. E mentre i dati e i grafici sono importanti, niente può sostituire l’esperienza umana di assistere alla vita in prima persona.
È qui che entra in gioco l’arte. Nel corso della storia, gli artisti hanno usato il loro lavoro per portare le persone in luoghi lontani e far luce sulle sfide profonde che l’umanità deve affrontare. In un’importante continuazione di quell’eredità, oggi gli artisti Refik Anadol e il collettivo femminile Hyphen Labs si pongono domande come “Cosa vedremmo se analizzassimo la Terra per rilevarne i danni?” e “Come percepiremmo gli effetti a cascata dello scioglimento dei ghiacci?”. Offrono una risposta in due nuove opere d’arte online pubblicate oggi come parte del nostro programma Heartbeat of the Earth. Questo programma, da Google Arts & Culture e UN Climate Change, invita gli artisti a interpretare i dati climatici scientifici attraverso opere d’arte interattive online.
Queste nuove opere d’arte si aggiungono alle otto già pubblicate dall’inizio del programma nel 2020, con l’obiettivo di rendere più accessibili e visibili i dati relativi alla crisi climatica.
“Ogni giorno gli effetti del cambiamento climatico diventano più veloci ed evidenti, ed è quindi più importante che mai coinvolgere gli artisti e usare la cultura come mezzo per trasmettere il messaggio urgente relativo alla crisi climatica”, spiega Ovais Sarmad, vicesegretario esecutivo dell’UNFCCC. “La scienza e i dati complessi devono essere mostrati in modo da suscitare emozioni e da consentirci di capire gli effetti del riscaldamento globale su tutti noi come individui e collettività.”
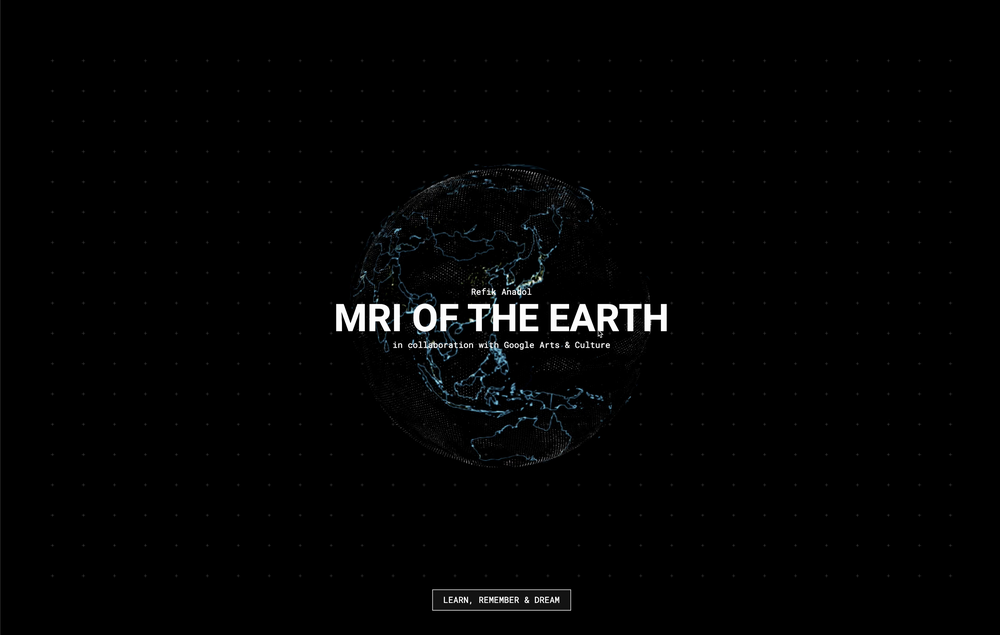
MRI of the Earth – Cosa vedremmo se analizzassimo la Terra per rilevare i danni?
L’artista Refik Anadol interpreta il “corpo” del nostro pianeta mostrando i danni che stiamo infliggendo tramite il cambiamento climatico. Anadol invita poi a riflettere sulla bellezza della Terra usando visualizzazioni dei paesaggi naturali del pianeta generate tramite il machine learning e a ispirare azioni per un futuro migliore.
Insidious Rising – Come percepiremo gli effetti a cascata dello scioglimento dei ghiacci?
Scopri i vari fattori che influiscono sul pianeta e i problemi del pianeta rappresentati tramite lo scioglimento di un ghiacciaio. Il collettivo internazionale di artiste Hyphen Labs esamina in collaborazione con la poetessa e portavoce locale Allison Akootchook Warden gli effetti a cascata dello scioglimento dei ghiacci polari e il modo in cui un clima sempre più caldo non soltanto porterà al collasso ecologico, ma farà pressione anche sui sistemi esistenti che incidono già sproporzionatamente sugli emarginati.
Ci auguriamo che queste opere artistiche e sul clima portino le persone a volerne sapere di più sulla crisi climatica e invitino all’azione.
Bringing the science of climate data to life through art
Some of the most dramatic climate-fueled changes on our planet are happening in places most of us have no way of visiting. And while data and charts are important, nothing can replace the human experience of witnessing life first-hand.
That is where art comes in. Throughout history, artists have used their work to take people to faraway places and shed light on deep challenges facing humankind. In an important continuation of that legacy, today artists Refik Anadol and female collective Hyphen Labs are asking questions like “What would we see if we scanned the earth for damages?” and “How will we feel the cascading effects of melting ice sheets?”
They offer an answer in two new online artworks published today as part of ourHeartbeat of the Earth program. This program, from Google Arts & Culture and UN Climate Change, invites artists to interpret scientific climate data through interactive online artworks.
These new artworks add to the eight published works since the programstarted in 2020, with the goal of making the data behind the climate crisis more accessible and visible.
“With the impacts of climate change accelerating and becoming more evident every day, it’s more important than ever to engage artists and to use culture as a vehicle for the urgent message around the climate crisis,” said Ovais Sarmad, deputy executive secretary of UN Climate Change. “Complex science and data needs to be displayed in an emotional way, allowing us to understand how global heating impacts us all individually and collectively.”
MRI of the Earth— what would we see if we scanned the Earth for damages?
Artist Refik Anadol interprets our planet’s ‘body’—exposing the harm we are inflicting on it through climate change. Anadol then invites you to reflect on the Earth’s beauty through machine learning generated visualizations of the Earth’s natural landscapes and inspire actions for a hopeful future.
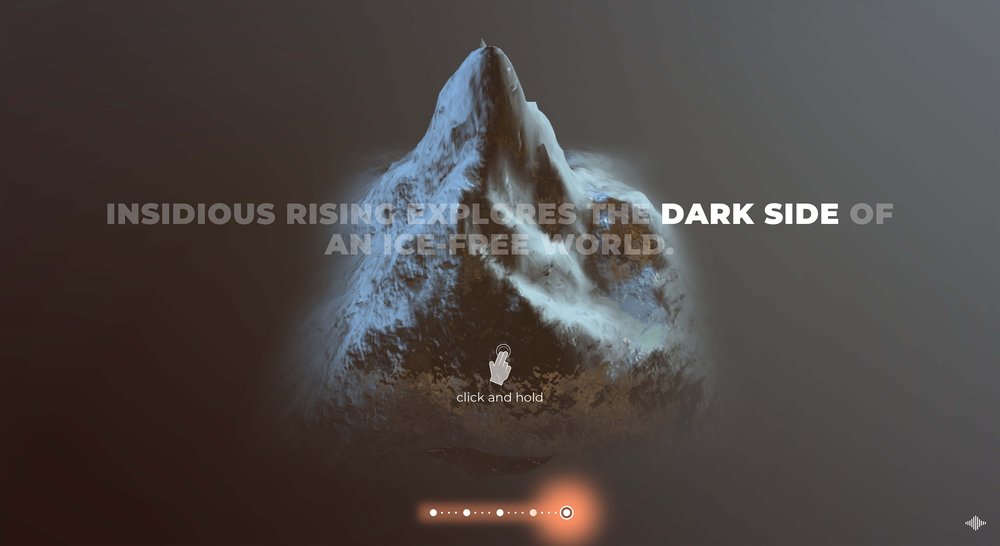
Insidious Rising— How will we feel the cascade effects of warming ice sheets?
Global female artist collective Hyphen Labs, together with Iñupiaq (indigenous from North Alaska) artist Allison Akootchook Warden and the Union of Concerned Scientists, explore the cascade effects of warming polar ice sheets and how a warming climate will not only trigger ecological collapse, but also put pressure on existing systems that already disproportionately affect the marginalized.
We hope these artworks will encourage people to learn more about the climate crisis and inspire action.
Fatti un regalo: questa macchinetta capelli e barba Philips al MINIMO

Cuocipappa per bebè a PREZZO PAZZO: il regalo perfetto ai neogenitori

Konami e Milan: firmato l’accordo per la partnership
Why this engineer made a career move after 25 years
Welcome to the latest edition of “My Path to Google,” where we talk to Googlers, interns, apprentices and alumni about how they got to Google, what their roles are like and even some tips on how to prepare for interviews.
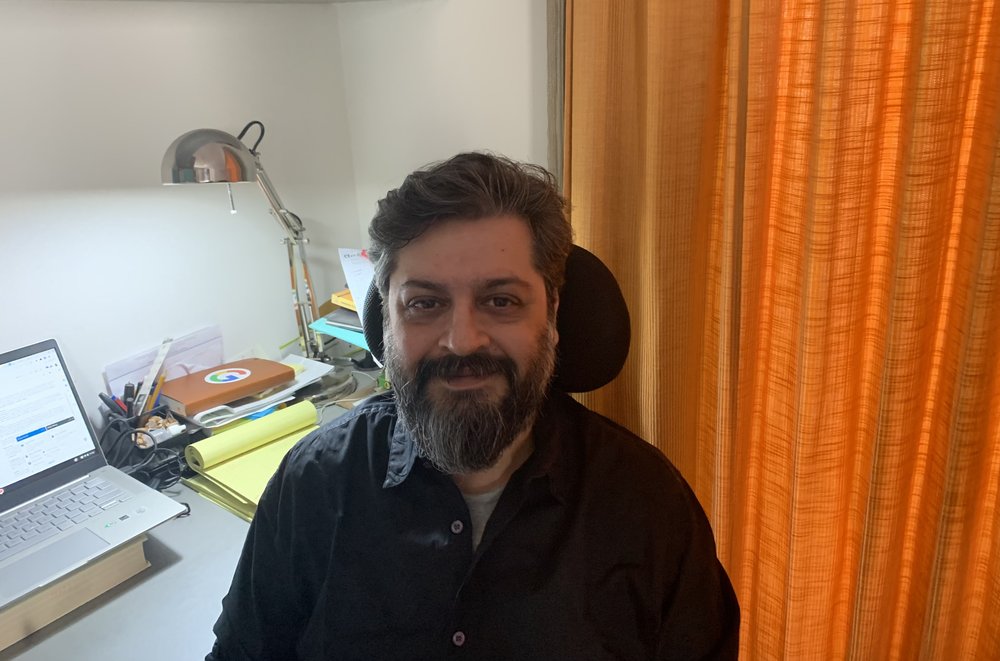
Today’s post is all about Manav Mediratta, an Engineering Manager based in Bengaluru, India who made a career change after 25 years to follow his passion for AI.
How would you describe your role?
I’m an Engineering Manager on Google’s Silicon team, which develops software for Google’s hardware products — like Google Tensor, the chip used in Pixel phones. We keep Google’s research in AI and machine learning at the center of our work.
What does your typical workday look like?
My days vary, but I usually focus on growing our relatively new teams in Bengaluru and Hyderabad. I also work with teammates in Taiwan to make sure we’re on track to deliver new devices for our customers. Because we work in such a fast-moving industry, we need to stay on our toes every day.
Manav working from his home office
What made you decide to apply to Google?
I worked in the same company for more than 25 years before I joined Google, so this is only my second job. Throughout my career, I discovered my passion for developing products with both hardware and software components. When I saw that Google had started the Silicon team, I was drawn by the potential to focus on this passion and create impact through machine learning and AI. Plus, I knew it would be a fun ride and a great opportunity to solve interesting problems.
What’s your favorite part of your job?
A lot of hard work goes into these small devices in our hands, and I’m always inspired by the difference it makes in people’s lives. Think about translation apps that bridge language gaps or camera features that capture memories — these are important, real-life moments powered by technology built by our team.
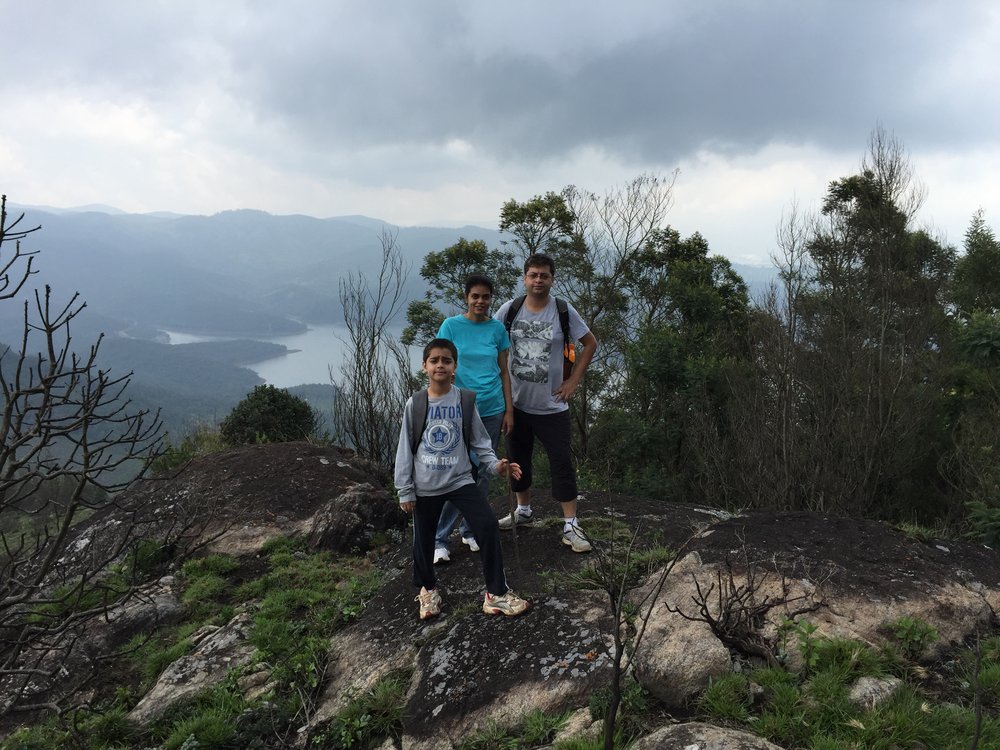
Manav and his family
What was your application and interview experience like?
It was very smooth and accommodating! At first, the interviews seemed extensive and intimidating. But I learned you can work with your recruiter to organize an interview schedule that suits you. Google offers a lot of flexibility like this to help candidates feel comfortable. A couple of my interviews will always stick with me. They never felt like tests — they were conversations with passionate practitioners who were honest about what they did and just wanted to see how I’d fit in.
Any particular methods you used to prepare for your interviews?
I wrote down the top 10 problems I’ve solved throughout my career, technical or otherwise. This is very helpful to have on hand for any behavioral or situation-based questions.
What advice do you have for aspiring Googlers?
Everyone feels nervous before an interview — I definitely did! But I quickly realized that Google has designed the interview process to bring out the best in you. So be an active participant and co-create the interview experience you want. And don’t be afraid to take the plunge!
Motorola Moto G60s a MENO di 200€ su Amazon (-80€)